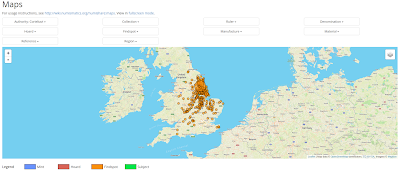
At long last, I have implemented some contextual changes in the display of points in the maps pages in the Numishare platform, particularly with respect to the sizing of points to reflect density of distribution (like what had already been implemented in maps on nomisma.org and record pages in Numishare).
The changes can be summarized as follows:
- Mint, findspot, and geographic subject (applies to Art of Devastation only, so far) layers have variable sizing based on density.
- The marker cluster plugin has been disabled for individual findspots, so each point is readily apparent without further zooming into the map.
- The findspot layer now refreshes correctly after narrowing the search facets down.
- Symbol facet menus now display the correct, human-readable label, and monogram SVG graphics will appear in the menu, as it functions on the browse page.
These visualization updates have also been implemented in the map popup window on the browse page.
The changes are most readily apparent in the Celtic Coins Index Digital.
 |
| Findspot distribution of the Corieltavi. |
And Hellenistic Royal Coinages clearly illustrates the highest level of production in Amphipolis and Alexandria:
And while the general map of the Roman Empire isn't particularly illustrative (about half of all types minted in Rome), when you drill down into specific queries, the variations in production are more apparent.
 |
| Mint distribution of Constantine I |


No comments:
Post a Comment
Note: Only a member of this blog may post a comment.